

Spreadsheets
Response
![]()
ReStackor User Manual
Finally computer software to tune a shim stack
ReStackor Suspension Response
ReStackor response calculations compute suspension bottoming velocities for the chassis and wheel; stroke averaged rebound zeta coefficients and forces acting on the suspension over the stroke. The response calculations use the shocks damping force computed by ReStackor pro which include the shocks gas force and fork ICS system forces. Response calculations are a separately purchased add-on to ReStackor pro and run on the “response” tab of mid-valve spreadsheets.
![]()
Suspension link ratio
ReStackor suspension response calculations compute the suspension link ratio from measurements of shock and wheel position. At least four measurements are needed. More measurements (up to 39) improve the fidelity of the link ratio curve.
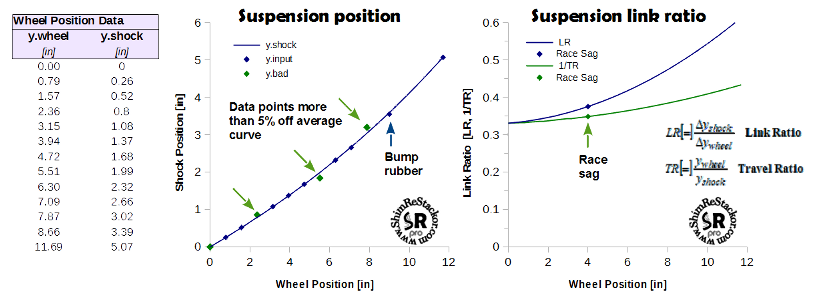
ReStackor curve fits the wheel position measurements and any data points more than 5% off the “average curve” are flagged with green data point symbols. Flagged data point need to be double checked to insure fidelity of the link ratio curve. The last input in the table is the suspension max travel and shock stroke length. ReStackor uses that final input to define suspension travel limits.
The stroke depth where the shock contacts the bump rubber is an important position to note in the suspension stroke data. Up to that point suspension motions are controlled by the spring and shock. Beyond that point suspension motions are controlled by the bump rubber stiffness. For practical tuning the bump rubber stroke depth defines the tuning range for the shock.
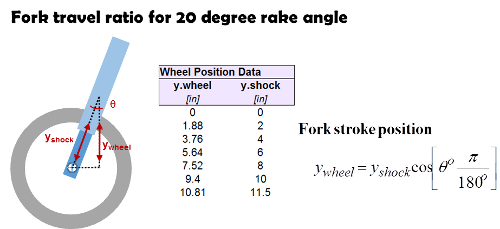
On a fork the cosine of the fork rake angle defines the suspension link ratio. That angle defines how far the wheel moves vertically for a given change in fork stroke and remains constant over the stroke range. When computing that value in a spreadsheet it is important to recognize spreadsheets measure angles in radians. To convert degrees to radians multiply by pie/180 (radians= fork degree*3.14159/180). Link ratios for a fork are input the same way as a shock using a table of wheel position versus shock position measurements.
![]()
Suspension bottoming velocity
There are two ways to bottom a suspension:
-
Hit a bump hard enough to bottom the wheels
-
Hit a landing hard enough to bottom the chassis
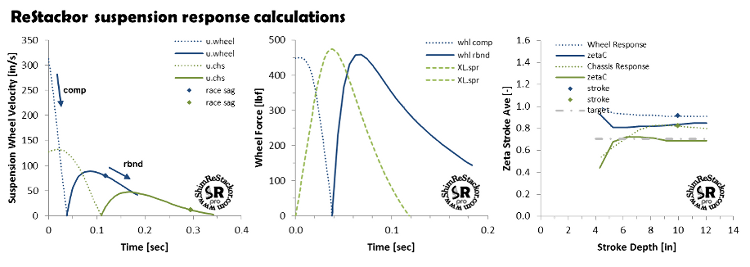
Wheel bottoming calculations start from race sag, where all bumps start, and determine the wheel bump speed that produces enough momentum to blow through the compression stroke and tap the input specified “Max Stroke” position with a final velocity of zero. On compression wheel momentum fights the spring force, gas force and compression damping of the fork or shock.
From the "Max Stroke" position the calculations continue into the rebound stroke computing wheel velocities as the suspension returns to the suspension normal ride height. Rebound velocities are noted by solid lines and compression velocities by dashed lines in the suspension response curves.
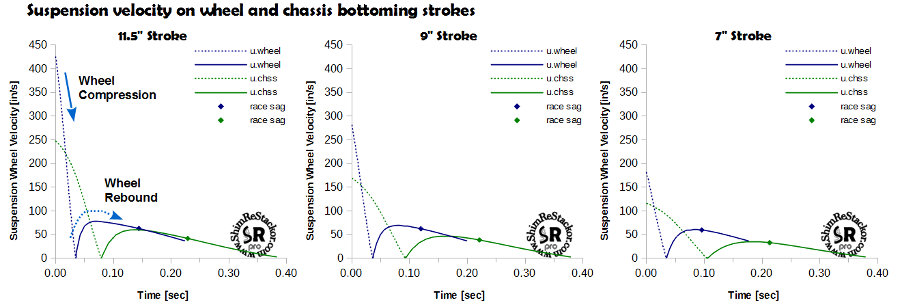
On the chassis bottoming stroke (green curves) the calculations determine the free fall impact velocity necessary to compress the suspension from full extension to the specified “Max Stroke” position. The calculations continue into the rebound stroke to determine velocities as the chassis returns to the normal ride height.
Symbols on the plot mark the time required for the suspension to return to the normal “race sag” ride height.
Sprung and un-sprung weight
Wheel bottoming velocities are determined using the input value of wheel weight. The input wheel weight needs to included the wheel, axle, brake caliper, stanchion tube, chain and everything else bouncing up and down with the wheel. A practical measure is pull the spring out of the bike and put a bathroom scale under the wheel.
Chassis bottoming is determined using the chassis plus rider weight. Chassis weight is set by the input curb weight and specified front/rear weight split. Rider weight is determined by the spring force at race sag plus spring preload minus chassis weight.
Chassis bottoming response assumes the rider is standing. On compression the suspension brings both the rider and chassis mass to rest. The rider is assumed to use an additional 12 inches of leg stroke to minimize rider deceleration on the compression stroke. On rebound the suspension supports both the chassis and rider but the chassis is the only moving mass considered in damping response.
![]()
Shock shaft velocity at suspension bottoming
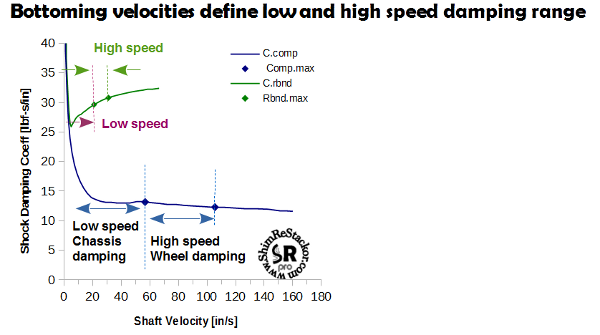
Suspension response is reported both in terms of suspension wheel speed and shock shaft velocity. The shocks low speed damping range is defined by the chassis bottoming velocity and the high speed range by the wheel bottoming velocity. When the suspension bottoms there are two velocities of interest: the maximum velocity in compression and the maximum velocity in rebound.
ReStackor response calculations mark those velocities on the damping force curve. For the example below the wheel bottoms on the compression stroke at a shaft velocity of 110 in/sec and the maximum rebound speed is 35 in/sec. Marking those limits on the damping force curve is a simple check to insure ReStackor pro damping force calculations have been run over the appropriate shaft velocity range for the suspension setup.
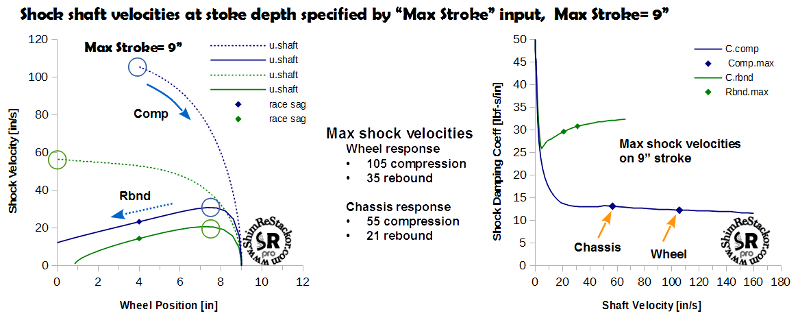
The chassis bottoming velocity (low speed damping) and wheel bottoming velocity (high speed damping) are important limits to understand when tuning a shock. Knowing where those limits occur allow the preload on shim stack ring-shims to be tuned for control of the appropriate low speed damping range for chassis control and tuning crossover gaps to close at the right velocity for control of high speed wheel damping. Visualizing where those transitions occur on the shocks damping force curve makes tuning both easier and more effective.
![]()
Optimum suspension response
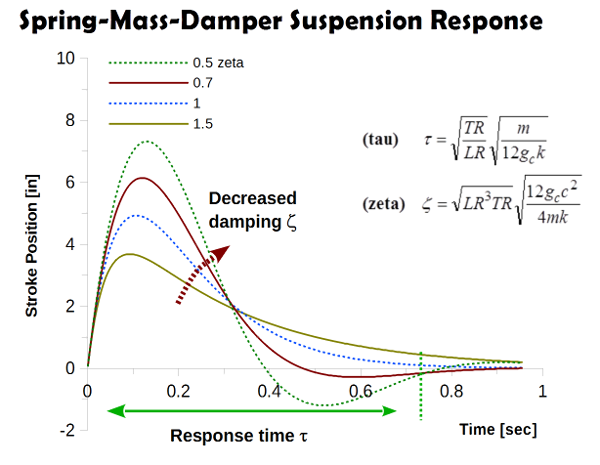
Fast suspension response and random motions over unequally spaced bumps makes tuning of suspension systems for optimum response difficult. Understanding suspension response is a whole lot easier using the simplifications of spring-mass-damper theory. Spring-mass-damper theory defines two parameters that control suspension response: tau and zeta.
-
Tau: Defines how long it takes the suspension to return to the normal ride height, aka 1.0/(suspension natural frequency)
-
Zeta: Defines the shocks damping authority
Suspension response time, tau
Tau defines how long it takes the suspension to return from the max stroke position to race sag. The central parameter in tau (shown in the figure below) is mass divided by spring rate. That ratio is basically equivalent to race sag. When suspensions are setup to hit a specific race sag target the value of tau is basically fixed. That makes tuning easier sense tau is set by race sag concerns.
Damping control, zeta
Zeta combines the effect of mass, spring rate, link ratio and damping into a single parameter (zeta) and the value of that parameter instantly tells you how the suspension will respond.
-
Zeta values greater than one are over damped. Over damped suspensions respond slowly making for poor compliance, a harsh ride and a setup prone to packing. The feature of an over damped suspension is it will not oscillate or baby-buggy after a bump.
-
Zeta values less than one are under damped. Under damped suspension respond faster which minimizes packing. That gets the wheels back on the ground faster. The problem is the suspension will baby-buggy after a bump and that reduces rider feel and control.
The important fact about zeta is the individual values of mass (m), spring rate (k), link ratio (LR, TR) and damping (c) do not matter. All that matters is the ratio of those parameters and if that ratio gives the same zeta value the suspension will respond exactly the same regardless of weight, spring rate or damping. That makes the tuning motorcycles, trophy trucks or rally cars the same thing. Suspension motions are simply either damped or they are not.
The big question for suspension tuning is how much damping does it take to optimize suspension response? Spring-mass-damper theory answers that question.
The worst case for any suspension is hitting the next bump at the point where the suspension is just returning from the previous bump. When that happens residual energy from the previous bump gets augmented by the current bump impact and that drives the suspension into resonance. Spring-mass-damper theory defines zeta values of 1/sqrt(2)= 0.707 as the minimum damping required to suppress suspension resonance motions. Go to stiffer damping and the slow rebound response causes the suspension to pack. Go softer than zeta of 0.7 and the suspension baby-buggies.
Spring-mass-damper theory defines zeta values of 0.7 to 0.75 to give the fastest possible rebound response with damping that is still stiff enough to damp suspension resonance. That fact sets the values needed for rebound damping.
Linked suspension system response
The problem in optimizing zeta response in linked suspension systems is the value of zeta changes over the stroke due to changes in link ratio and the shape of the shocks damping force curve. ReStackor analysis of a 9 inch crf250 suspension stroke provides an example. As the suspension rolls into the rebound stroke at a depth of 9 inches, zeta values spike into an over damped condition at values around 1.5. That spike is caused by the increase in link ratio deep in the stroke and the high damping coefficient of the shock at low velocity. As the suspension unloads into the rebound stroke the value of zeta falls to end up near critical damping on return to the suspension normal ride height. The point where the suspension returns to race sag is marked on ReStackor suspension response plots by the shown symbol.
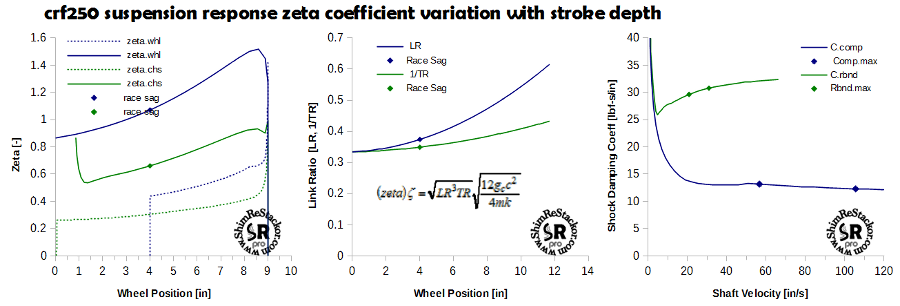
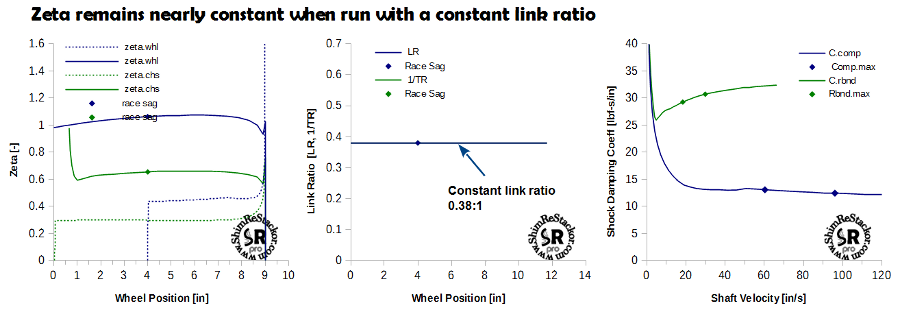
The nonlinear behavior of zeta is almost entirely due to the change in link ratio over the stroke. That can be demonstrated by re-running the above case with a constant link ratio. When run with a constant link ratio the value of zeta turns out to be nearly constant over the suspension stroke.
![]()
Stroke averaged zeta coefficient
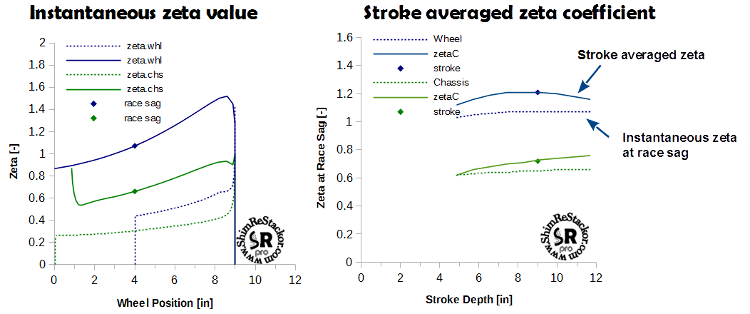
For tuning linked suspension systems a stroke averaged zeta coefficient is needed. ReStackor determines that stroke averaged zeta value by finding the zeta value that goes through the same suspension stroke, in the same amount of time and returns to the normal ride height at the same final velocity. That creates a stroke averaged zeta coefficient that dissipates the same bump energy, in the same stroke, in the same amount of time. ReStackor plots the stroke averaged zeta coefficient as parameter zetaC. ZetaC is the recommend parameter for use in tuning.
The value of zetaC over the range of suspension stroke depths is determined in ReStackor through an internally automated series of calculations. The calculations begin at short stroke depths determining the averaged zetaC coefficient for that stroke and sequentially progress to deeper strokes across the suspension stroke range. ZetaC results are plotted as solid lines and show the suspension response trend over the range of stroke depths.
ReStackor also plots the instantaneous value of zeta (dashed line) at the point where the suspension returns to the normal race sag ride height. The difference between those curves quantifies the bump energy dissipated by the nonlinear link ratio over the suspension stroke. For the example shown that works out to a zeta increase of about 10% to 20% with the effect maximized at a stroke depth around 8 inches for the wheel response curve.
![]()
Baseline suspension setup
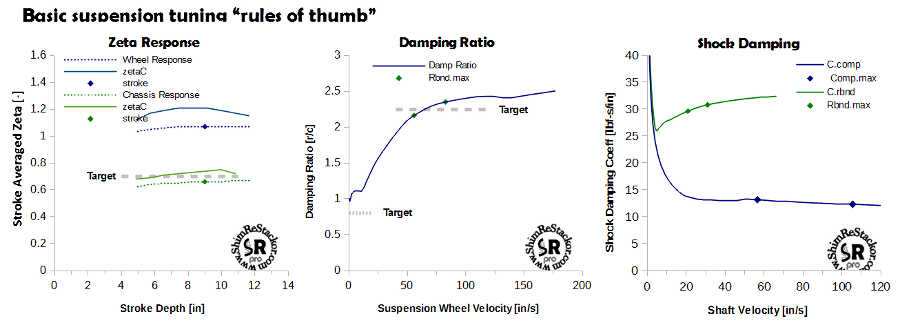
Basic suspension tuning “rules of thumb” give tuning targets for a baseline suspension setup, aka suspension tuning secrets. ReStackor response calculations combine chassis weight and spring rate with the shocks damping force curve to produce the suspension response information needed to hit those tuning targets.
-
Rebound damping: zeta 0.7 to 0.75
-
Compression damping:
-
shocks: 2.0 to 2.5:1 r/c damping ratio
-
forks: 3.0 to 3.5:1 r/c ramping ratio
-
-
Low speed compression
-
r/c damping ratio of 0.8:1 below 3 to 6 in/sec
-
Zeta rebound damping
The stroke averaged zeta curve shows the rebound damping zeta response for the chassis and wheels. Target values are 0.7 to 0.75. Street setups damp the chassis at low speed and the wheels at high speed using highly digressive rebound damping force curves. Dirt setups damp the chassis through the entire range of stroke depths.
Damping ratio
The shock damping ratio curve plots the ratio of rebound/compression damping measured at the same shaft velocity. The low speed tuning target is a damping ratio of 0.8:1 below suspension speeds of 3 to 6 in/sec. Hitting that target requires tuning of clicker bleed circuits and valve port leak jets.
The baseline high speed targets are 2.0 to 2.5:1 for a shock and 3.0 to 3.5:1 for a fork. Hitting those targets require tuning of the compression shim stacks. Rebound damping is set by zeta.
Shock damping coefficient
The shock damping coefficient curve plots the combined compression damping force of the shocks base and mid-valve; and the shocks rebound damping force computed by ReStackor pro. Symbols on the plot mark the stroke velocity for the requested “MAX STROKE” depth and are useful for tuning of stack preload and crossover gaps to affect the appropriate damping force range. Those symbols are also useful to insure ReStackor pro damping force calculations are run over the appropriate shaft velocity range.
![]()
Suspension force over stroke
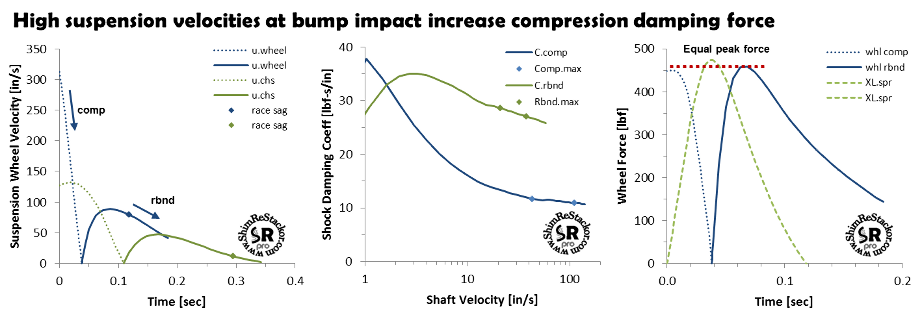
When measured at the same shaft velocity compression damping is much softer than rebound. When installed in a suspension the high suspension velocities at bump impact drive compression damping forces up. Rebound damping fights against the spring force creating a stall speed in the rebound stroke. Lower velocities at that stall speed drive the shocks rebound damping force down. The target “rule of thumb” damping ratios of 2.25:1 for a shock and 3.25:1 for a fork produce peak compression damping forces that are approximately equal to the peak rebound force. The ReStackor force over stroke plots are a useful reference to check those peak damping force values.
-
The dotted blue line shows the compression damping force over stroke
-
The dashed green line shows the spring force over stroke. On the chassis stroke the neutral position is race sag and spring force is measured as a displacement for race sag. On the wheel stroke the neutral position is full extension and the spring force zero point is full extension
-
The solid blue line shows rebound damping force over the stroke
![]()
Enduro and MX setups
MX setups run stiff springs to prevent bottoming. Enduro setups run soft springs to improve compliance. Compression damping is tuned differently in those setups to work with the bottoming versus suspension compliance trade.
For the suspension to deal with square edge root and rock impacts enduro setups focus on suspension compliance. To give a consistent “feel” on high speed hits the wheel bottoming stroke on enduro setups are tuned to give a peak compression damping force equal to the peak spring and rebound force. Equal forces gives the suspension a consistent “feel” through the wheel bottoming stroke on high speed hits.
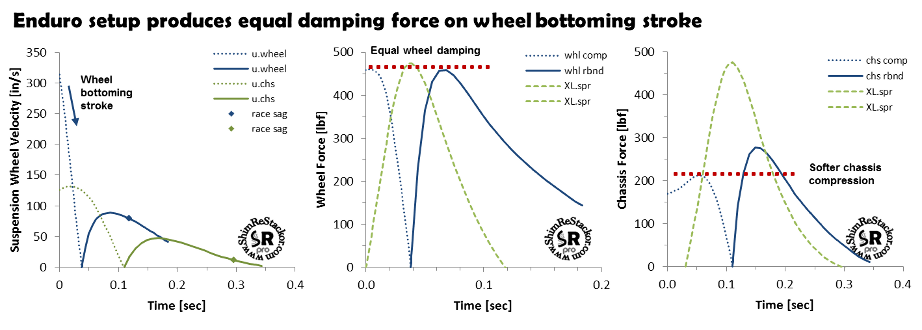
The criteria for equal damping force on the wheel bottoming stroke sets the rebound/compression damping ratios used in the baseline suspension setup. For that enduro based setup lower suspension velocities on the chassis bottoming stroke force lower compression damping values. That creates a "plush" chassis bottoming stroke.
MX setups focus on chassis bottoming control for jump landings. To get a consistent “feel” through the chassis bottoming stroke compression damping forces are increased to give a peak force that is equal to the peak rebound force. That equal force gives a consistent "feel" on the chassis bottoming stroke. Setting chassis compression damping to match rebound peak forces requires rebound/compression damping ratios in the range of 1.6:1.
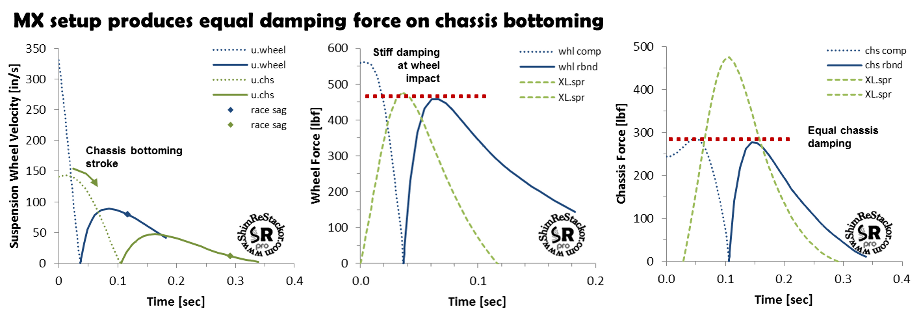
Stiffer compression damping used on an MX setup forces the wheel bottoming stroke to have a peak compression damping force that is higher than the peak spring force. That creates a setup that is stiff on bump impact and then blows through as forces fall to the peak spring force at bottoming. High compression damping forces on the wheel bottoming strokes makes MX setups stiff on square edge impacts and is the reason why MX setups don’t work very well on the trail. For groomed MX tracks square edge impacts are not a tuning issue.
![]()
Street and dirt setups
Street setups tune rebound damping to damp the chassis for small bump motions around race sag. Chassis damping gives control pushing the bike into and out of corners. The shocks rebound damping force falls off at high speed to give the lighter damping needed to control the wheels on high speed suspension motions. Getting the shock to switch from low speed chassis damping to high speed wheel damping requires a highly digressive rebound damping force curve.
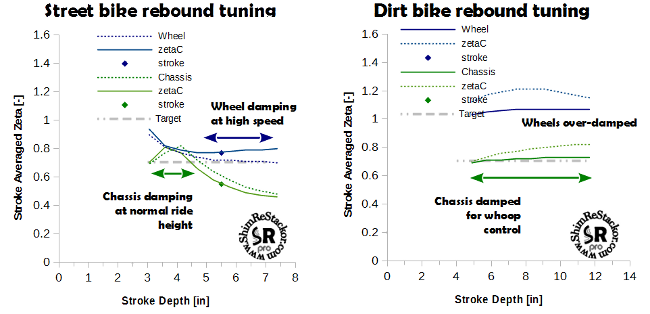
Dirt setups are tuned differently. Dirt setups tune rebound damping to control the chassis over the entire range of suspension travel. That stabilizes the chassis through whoops but pushes the wheels into an over damped condition. The fix for that is run the tires at low pressure and rely on tire compliance to suck up high speed terrain motions.
